What you will learn
- How to structure literature data for comparison
- Why shared axes reveal trends single studies hide
- How to digitize published figures
Set up
pip install numpy matplotlibFiles for this tutorial:
plot_matrix.py— Plot matrix from a tidy CSVexample_points.csv— SYNTHETIC example data, format only
How it works
Digitize
Extract points from each source paper’s figures (for example with WebPlotDigitizer). Record coating, environment and test conditions next to every value.
Tidy
One row per point: reference, coating, environment, temperature_K, metric, value.
Plot
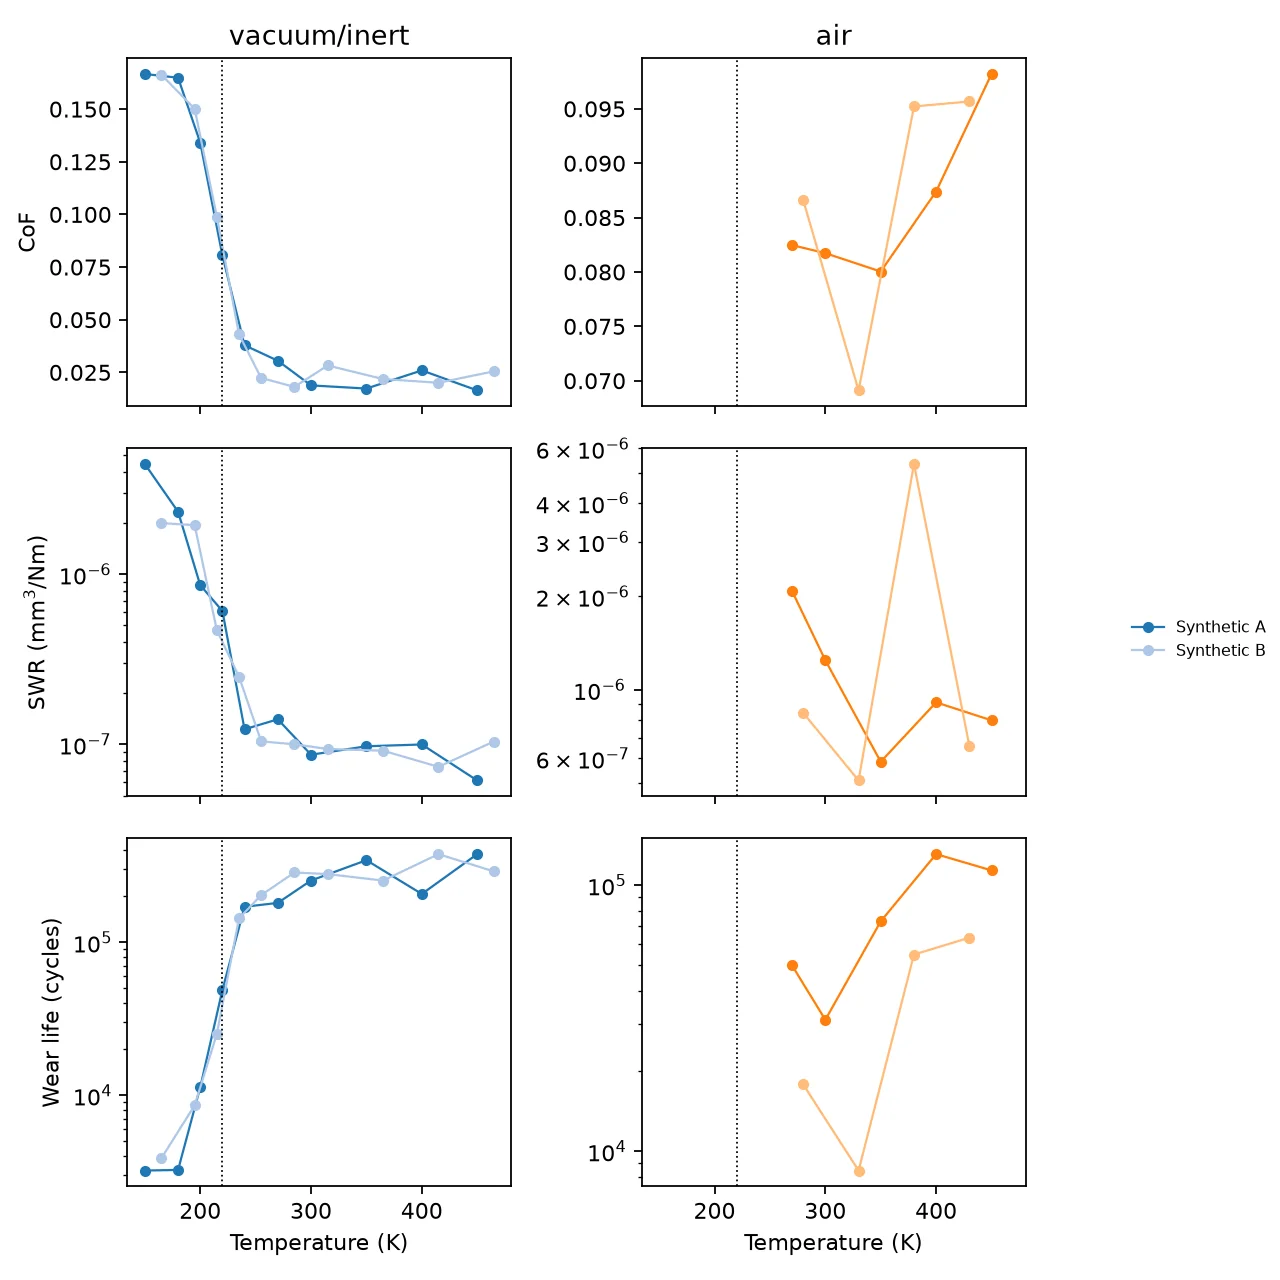
Rows are metrics (CoF, SWR, wear life) and columns are environments (vacuum/inert vs air). A dotted line marks 220 K, where the review found the low-temperature transition.
Run it
python plot_matrix.py example_points.csvWhat you should see
How this differs from the paper
The review compiled data from 21 references. The bundled example is synthetic and only demonstrates the format and the plot.
Full source
plot_matrix.py (67 lines)
plot_matrix.py
"""Tutorial — Build a temperature "plot matrix" from published tribology data.

Faiyad, Miliate et al., Tribol. Lett. 73, 114 (2025) compiled friction coefficient (CoF), specific
wear rate (SWR) and wear life of MoS2 dry films from 21 references into one matrix of plots:
rows = metric, columns = environment (vacuum/inert gas vs air). Seeing every study on shared axes
revealed the transition near 220 K that no single study could show.

This script makes that matrix from a tidy CSV, one row per data point:
    reference, coating, environment, temperature_K, metric, value
    metric is one of: CoF, SWR_mm3_per_Nm, wear_life_cycles

How to get real data: digitize the figures of the original papers (for example with
WebPlotDigitizer, https://automeris.io), and record the coating and environment for every point.
The bundled example_points.csv is SYNTHETIC. It only shows the format and is not literature data.

Run:   python plot_matrix.py example_points.csv
Output: out/plot_matrix.png
"""
import csv
import sys
from collections import defaultdict
from pathlib import Path

OUT = Path(__file__).parent / "out"
OUT.mkdir(exist_ok=True)
METRICS = [("CoF", "CoF", False), ("SWR_mm3_per_Nm", "SWR (mm$^3$/Nm)", True), ("wear_life_cycles", "Wear life (cycles)", True)]
ENVS = ["vacuum/inert", "air"]


def main(path):
    data = defaultdict(list)
    with open(path, newline="") as f:
        for r in csv.DictReader(f):
            env = "air" if r["environment"].strip().lower() == "air" else "vacuum/inert"
            data[(r["metric"], env, r["reference"])].append((float(r["temperature_K"]), float(r["value"])))
    refs = sorted({k[2] for k in data})
    import matplotlib
    matplotlib.use("Agg")
    import matplotlib.pyplot as plt
    cmap = plt.get_cmap("tab20")
    fig, axes = plt.subplots(3, 2, figsize=(8, 8), sharex=True)
    for i, (m, label, logy) in enumerate(METRICS):
        for j, env in enumerate(ENVS):
            ax = axes[i, j]
            for k, ref in enumerate(refs):
                pts = sorted(data.get((m, env, ref), []))
                if pts:
                    ax.plot(*zip(*pts), "o-", ms=4, lw=1, color=cmap(k % 20), label=ref)
            ax.axvline(220, color="k", ls=":", lw=0.8)
            if logy:
                ax.set_yscale("log")
            if j == 0:
                ax.set_ylabel(label)
            if i == 0:
                ax.set_title(env)
            if i == 2:
                ax.set_xlabel("Temperature (K)")
    handles, labels = axes[0, 0].get_legend_handles_labels()
    fig.legend(handles, labels, loc="center right", fontsize=7, frameon=False)
    fig.tight_layout(rect=(0, 0, 0.82, 1))
    fig.savefig(OUT / "plot_matrix.png", dpi=160)
    print("wrote", OUT / "plot_matrix.png")


if __name__ == "__main__":
    main(sys.argv[1] if len(sys.argv) > 1 else Path(__file__).parent / "example_points.csv")